
Our previous article on the banking crisis looked at Silicon Valley Bank’s (SVB) 2022 10-K to determine the reason for their failure. Our analysis revealed that the bank’s customers had fewer deposits, and its debt portfolio incurred mounting losses due to inadequate risk management. Both of these situations were largely attributed to Silicon Valley Bank’s inability to respond to rising interest rates.
So the next question in the banking crisis of 2023, is this crisis just limited to Silicon Valley Bank? Business media reports that First Republic Bank is next, and that other regional banks are also under pressure. In this article, I will utilize the findings from our previous analysis of Silicon Valley Bank to create a screener to identify other banks that may be in jeopardy.
Table of Contents
Our Previous Banking Crisis Results Summarized
We know from the failing at Silicon Valley Bank that we’re hunting for a couple of dynamics:
- Falling customer deposits: SVB’s customer deposits fell just about 8.5% year over year from 2021 to 2022.
- Large losses on debt holdings: SVB had just over 8% losses on Held To Maturity (HTM) Bonds. Importantly, unrealized gain or losses on HTM debt are not counted as income or even other comprehensive income (OCI).
For the first result, we’ll model by looking at \frac{(Current\ Year\ Deposits - Prior\ Year\ Deposits)}{Prior\ Year\ Deposits} . For the losses on investments, we need to look two items. First, we look at Other Comprehensive Income as a percentage of Deposits or \frac{Other\ Comprehensive\ Income}{Prior\ Year\ Deposits} which will give insight into realized gains or losses as well as unrealized gains or losses on debt held available for sale. Second, we want to review unrealized losses on assets held to maturity which are not part of net income or OCI. Thus, we look at \frac{Unrealized\ Gains/Losses\ on\ HTM\ Securities}{Prior\ Year\ Deposits}. We’ll also want to look at OCI and Net Income.
If you’re not familiar with these concepts, read our previous installment on Silicon Valley Bank’s fall where I talk through these terms and how to read an individual financial statement.
Getting financial statements to analyze
Before the SEC mandated eXtensible Business Reporting Language (XBRL) – a structured format for financial statements – analysts would have to review each company’s financial statement to manually build the dataset. With XBRL, a program can extract the relevant financial information based on tags for each financial statement line item. Although still a painful process, the SEC has made pulling and interpreting XBRL statements much easier with new APIs. Using these new APIs, pulling financial statements for multiple companies is much easier.
The program’s approach is as follows:
- Obtain a list of tickers in the banking industry. I pulled this list from a large, unnamed financial aggregator which I probably broke 12 terms of service by downloading their data.
- Map the ticker to the SEC’s identifier, called a CIK code, using the SEC lookup.
- Download the aggregated financial statements from the SEC API.
- Read, normalize, and interpret the financial statements and generate a spreadsheet with the data.
- Create the above ratios for the financial statements for each bank.
For this effort, I used Python with Requests and RateLimit as my only external libraries. The code is available here on GitHub for perusal. It is not my best programming effort and using proper data structures would surely help. With that said, I had to address a few unique challenges:
- Not every bank reports timely with well structured data at the SEC. For instance, First Republic Bank failed to report to the SEC timely due to their troubles. These have to be ignored and manually reviewed.
- XBRL tagged data is inconsistent between reporting entities and even for the same reporting entity in different years. Thus our program logic has to handle different tags for the same financial statement line item and prioritize extracting the best tag; as well as handle changes in reporting formats between years.
- International banks may not provide enough information with the SEC, or they file using the International Financial Reporting Standards (IFRS) instead of the US Generally Accepted Accounting Principles (GAAP) accounting standard. I mostly ignored these cases. That removes Credit Suisse and Deutsche Bank from the analysis.
I’ll post a technical write-up on GitHub in the coming weeks.
Analyzing results to see who’s next in the banking crisis
The complete set of results is downloadable:
We know that Silicon Valley Bank kicked off the 2023 banking crisis with large reductions in year over year deposits of 8.5% and large losses in debt securities of 8% versus customer deposits. To set a reasonable threshold for our screen, I start with a reduction of 5% year over year in deposits or HTM debt losses of 5% versus deposits. Out of 239 banks in our sample, there are two banks with this profile.
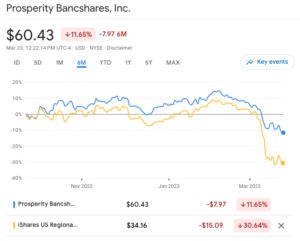
First, is Prosperity Bancshares (PB) with customer deposits dropping 7.27% YOY and HTM assets having an unrealized loss of 5.30% as a percentage of customer deposits. They seem to have similar dynamics to SVB, and while their stock is getting clobbered like all banks, PB’s stock price is doing well compared to other regional bank stocks.
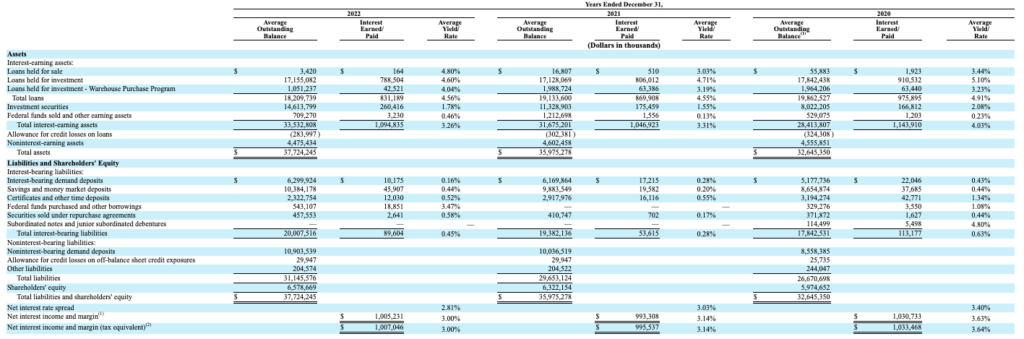
On the positive side, Prosperity holds a lot of real estate and farm loans which are generating a good deal of interest – 4.60% – based on table on page 37, and they are 55% to 45% split between loans and debt investments. Moreover, from the table on page 49, we see the average yield rate is at 3% versus 3.64% in 2020. While the yield rate is declining, it’s much better than the 2.16% earned by SVB in 2022.
As a further analysis, I would model the cash flows from the loans, versus what happens to the loan performance if interest rates continue to increase and deposits continue to rapidly decrease.
Second, surprisingly is Bank of America (BAC) with a drop of 6.50% in customer deposits year over year and a drop of 5.26% in HTM debt assets as percentage of customer deposits. BAC is a complicated beast to analyze and I’m scared to make any comments on them. BAC, like all large banking conglomerates, has many sources of income and hedging of risk. So I wouldn’t consider this analysis as anything more than a call to go deeper to see if more trouble is in store at Bank of America.
A third bank that didn’t make our screen, but still warrants attention is Citizen’s Holding Company (CIZN), the parent of Citizen’s Bank of Philadelphia. While Citizen’s doesn’t have a significant change in its deposits, its HTM Bonds have an unrealized loss of 2.81% as a percentage of customer deposits. Moreover, other comprehensive income (OCI) shows a 5.55% loss as a percentage of customer deposits.
The unrealized loss in its securities footnote doesn’t tie to the loss in OCI, and it’s hard to tell what they’re doing. I wonder if they converted some securities from AFS to HTM. That conversion would avoid showing unrealized losses for future periods in net income. I thought that conversion requires a footnote, but I can’t find one in their 10-K. In any event, these factors suggest CIZN participating in the 2023 banking crisis.
How to do this analysis better
There are several key limitations to the analysis on the banking crisis. First, the data quality is a challenge. Even using XBRL and the SEC’s new API, I’m sure that I’ve missed some banks in the results. Moreover, trying to identify and map all of the right statement tags has been challenging. Access to professional financial data aggregators would have yielded better results. The most glaring example is First Republic which is already under pressure and may be seized. Since they didn’t file 2022 results, we don’t have accurate data to work from.
Second, our model for evaluating what bank is at risk in the banking crisis is simplistic. I haven’t considered overall cash flow, derivative hedging, or loan performance. Our check is very simple – are deposits down and are investments down? While that gives us a good initial screen, it’s definitely not a complete model.
Third, I’ve only built this model for US domestic banks. To do the same analysis for international banks, I would have to consider IFRS accounting standards and then deal with tagging differences in XRBL and currency adjustments. Given the amount of time to do the analysis solely for US GAAP, I really didn’t want to commit the time to international banks.
Finally, in our analysis of US banking crisis, I haven’t consider how the FDIC and Fed’s response will play into the banks. The Fed rose interest rates and the FDIC seems to be making depositors whole at Silicon Valley Bank. These responses will surely alter the course of this crisis.
Conclusions on the Banking Crisis
We’ve been able to analyze the 10-K financial statements of over 200 banks using Python with the SEC’s new API and XBRL. We found three candidate banks that have similar financial problems as Silicon Valley Bank; and discussed why or why they may not fall victim to the banking crisis. Finally, we talked about the limitations of the analysis and how it could be improved. The good news in this analysis is that we found very few candidate banks that might succumb to the banking crisis.